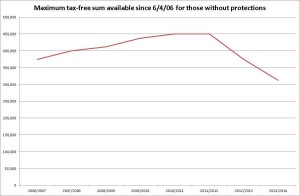
A quick Google search will highlight the number of times capping of pension’s tax-free cash has been floated. What is often forgotten is that a pension’s tax-free cash cap was introduced in April 2006 and is actually lower than it has ever been.
Final Salary schemes, which are generally generous in other regards, have been exposed to a tax-free sum cap since 1987; Personal Pensions which account for most savings outside the public sector had no tax-free lump sum cap prior to April 2006 (though contributions were restricted), and a cap of 25% of the standard lifetime allowance came in on 6th April 2006.
The graphic below (followed by a table) shows how the tax-free sum has fallen from the unlimited value to its lowest point from 6th April 2014. Given there have been, by my reckoning, seven changes in six years, maybe we could just leave pensions alone for this autumn statement and budget?

| Tax Year | Personal Pension | Occupational Pension |
|---|---|---|
| 1989/1990 | No limit | 90,000 |
| 1990/1991 | No limit | 97,200 |
| 1991/1992 | No limit | 107,100 |
| 1992/1993 | No limit | 112,500 |
| 1993/1994 | No limit | 112,500 |
| 1994/1995 | No limit | 115,200 |
| 1995/1996 | No limit | 117,900 |
| 1996/1997 | No limit | 123,300 |
| 1997/1998 | No limit | 126,000 |
| 1998/1999 | No limit | 131,400 |
| 1999/2000 | No limit | 135,900 |
| 2000/2001 | No limit | 137,700 |
| 2001/2002 | No limit | 143,100 |
| 2002/2003 | No limit | 145,800 |
| 2003/2004 | No limit | 148,500 |
| 2004/2005 | No limit | 153,000 |
| 2005/2006 | No limit | 158,400 |
| 2006/2007 | 375,000 | 375,000 |
| 2007/2008 | 400,000 | 400,000 |
| 2008/2009 | 412,500 | 412,500 |
| 2009/2010 | 437,500 | 437,500 |
| 2010/2011 | 450,000 | 450,000 |
| 2011/2012 | 450,000 | 450,000 |
| 2012/2013 | 375,000 | 375,000 |
| 2013/2014 | 312,500 | 312,500 |


