
Economic Growth
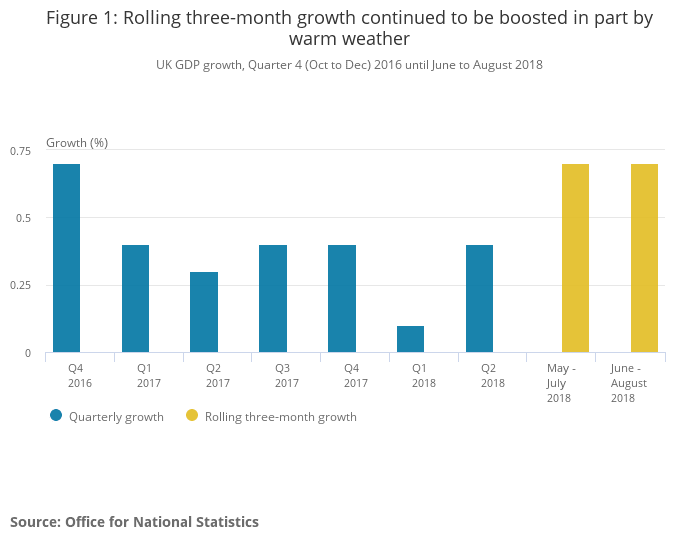
Changes to GDP (Gross Domestic Product) is the main indicator of economic growth. In the UK, GDP is estimated to have increased by 0.7% in the 3 months to August 2018 with all 3 main sectors (Services 0.42%, Production 0.10% and Construction 0.17%) contributing positively.
In Quarter 4 (October to December) 2017, UK GDP was estimated to have increased by 0.5%, compared with 0.4% in Quarter 3 (July to Sept) 2017.
Interest Rates
Following a unanimous vote by the Monetary Policy Committee (MPC) in September’s meeting the Bank Rate has been maintained at 0.75%.
The committee judged that the current stance of monetary policy remained appropriate and that “any future increases in Bank Rate are likely to be at a gradual pace and to a limited extent”
Inflation
Inflation measures the increasing price of goods and services used daily.
The Consumer Prices Index including owner occupiers’ housing costs (CPIH) 12-month inflation rate was 2.4 in August 2018, up from 2.3% in July.
The CPI 12-month rate was 2.7% in August 2018 up from 2.5% in July.
Source: ONS
UK House Price Index
As of July 2018 the average UK house price was £231,422. Property prices have risen 1.2% compared to the previous month and risen 3.1% compared to last year.
Source: Land Registry
Markets
Below we provide a table of the major sectors that we allocate to when constructing our client portfolios. The data has been sorted over 3 months in order of best to worst returns. We have shown returns on an annualised basis for 1 year and above.
| Sector | 3m | 1yr | Ann. 3yr | Ann. 5yr | Ann. 10yr |
| UT North America TR in GB | 7.32 | 19.61 | 21.82 | 16.51 | 14.17 |
| UT North American Smaller Companies TR in GB | 6.73 | 23.64 | 23.52 | 15.67 | 15.22 |
| UT Japan TR in GB | 4.00 | 12.41 | 19.39 | 11.95 | 10.17 |
| UT Sterling High Yield TR in GB | 1.82 | 1.18 | 5.72 | 4.18 | 6.82 |
| UT Europe Excluding UK TR in GB | 1.59 | 1.73 | 13.64 | 9.62 | 9.22 |
| UT European Smaller Companies TR in GB | 0.59 | 5.08 | 18.47 | 14.11 | 13.98 |
| UT Targeted Absolute Return TR in GB | 0.08 | 0.02 | 1.42 | 2.07 | 2.93 |
| UT Global Bonds TR in GB | -0.04 | -0.24 | 4.64 | 3.06 | 4.63 |
| UT Sterling Corporate Bond TR in GB | -0.22 | 0.11 | 4.13 | 4.35 | 5.71 |
| UT Property TR in GB | -0.39 | 4.29 | 5.08 | 5.94 | 3.60 |
| UT UK Smaller Companies TR in GB | -0.61 | 10.38 | 13.79 | 11.94 | 13.97 |
| UT Asia Pacific Excluding Japan TR in GB | -0.85 | 4.79 | 18.7 | 10.29 | 11.64 |
| UT UK All Companies TR in GB | -1.07 | 5.66 | 10.37 | 7.47 | 9.26 |
| UT Global Emerging Markets TR in GB | -1.14 | -0.92 | 17.25 | 7.20 | 8.19 |
| UT UK Index Linked Gilts TR in GB | -1.27 | 1.11 | 6.37 | 7.37 | 7.03 |
| UT UK Gilts TR in GB | -2.03 | 0.72 | 3.12 | 4.60 | 5.20 |
Source: FE Analytics to 30th September 2018
UT = Unit Trust, TR = Total Return and in GB = Currency Sterling
Market Commentary as at September 2018
With economies almost everywhere running at full capacity many central banks are concerned over the risk of inflation and as such interest rates are either beginning to rise or such monetary policies have been set.
There is the back drop of trade conflicts between the US and China along with other developed economies which at best creates uncertainty.
Government bond yields continue to be very low particularly here in the UK but also Europe and Japan, with the US only slightly higher. It is expected that yields will increase but not to any great extent and far slower than in previous cycles.
There is caution in the more established equity markets with many experts believing we are at a bit of a peak due to record profit margins in many regions, particularly the US. Certain emerging markets are seen by some as somewhat cheap in comparison due to the sell offs seen earlier this year. Despite not being hugely popular elsewhere the UK market may have more opportunities than the concerns over Brexit may be influencing with 60% of the FTSE 100 companies’ revenues generated overseas.
Short Term Volatility
We recognise that in periods of uncertainty and when investment markets are falling, clients may ask why we are not recommending a switch to cash to reduce or mitigate the impact of the falling markets. This is particularly the case when the market volatility occurs after a period of relative calm and steady growth, which has been the case over recent years.
The reason we tend not to recommend switching in to cash is that your investment strategy and underlying funds reflect your personal goals as well as your appetite for investment risk and the ability for you to bear losses. If there has been no change in these factors, then our advice would be to remain invested.
A switch to cash may instinctively seem sensible but trying to time the decision on when to move back in to the investment markets is far more difficult and the upturn in values can be easily missed.
All our portfolios carry a degree of risk and as such their unit price will move both up and down in different measures depending on their risk rating. We have already factored in to our recommendations that the value of your investments will fall as well as rise at different times.
However, if you feel at all uncomfortable with the volatility of any investment we are advising you on, please contact your adviser who can discuss this with you and if necessary carry out a reassessment of your ability to bear losses and appetite for investment risk.