Main points
- GDP growth has been slightly slower during 2015 than in 2014, and this pattern continued with quarter-on-quarter growth of 0.5% in the third quarter of this year.
- Annual CPI inflation has been flat at close to zero for most of 2015. This is a step down from the average rate of inflation during 2014 and 2013. Current weakness is driven by falling prices in the goods element of the CPI basket, and while services inflation has remained steadier at around 2.5% during 2015, this too has fallen from rates in earlier years.
- The labour market has continued to strengthen, with the employment rate at a record high while unemployment fell further.
- Analysis of recently published Annual Survey of Hours and Earnings (ASHE) data indicates that there has been an increasing concentration of total hours worked at or just above the National Minimum Wage level since 2005.
- Almost 70% of full time workers experienced positive real earnings growth in the year to April 2015, close to twice the proportion in 2011.
Introduction
- GDP continues to grow steadily, with growth being positive for ten consecutive quarters at an average rate of 2.5% on a quarter on quarter a year ago basis.
- GDP growth has been above the OBR’s estimate of potential growth since early 2013, and the output gap has been closing, though still remains slightly negative according to OBR estimates. A further indication of improving conditions is the sustained positive contribution to growth from household consumption and investment, both of which were weak during the early phase of the recovery but have been making steady, positive contributions to economic growth for the past two and a half years.
- The performance of retail sales growth reinforces this picture, with retail sales growth hovering around 5% month on month a year ago over the past year, up from around 4% during 2014 and 1-2% during 2013. The latest retail sales figures reinforce the strength of growth in the non-store retailing sector, including internet sales, although this sector is still small in comparison with shopbased retail sales.
- Inflation remains essentially flat, at close to zero, as it has been for most of 2015. The weakness of inflation primarily reflects goods-based inflation, which has been firmly negative, whereas services based inflation has been steady at around 2.5% for much of 2014 and 2015, though it has come down since 2012 and 2013. The stronger decline in goods prices than services prices reflects a mixture of factors, but includes the greater contribution to goods prices from primary commodities and industrial materials which have seen falls over the past year, particularly for oil and petroleum based inputs, and the appreciation of sterling bringing down the domestic price of imports.
- The labour market continues to show strength, with the employment rate at a record high and unemployment falling towards historic lows. The inactivity rate has come down to 22% in 2015 from 23.5% in mid-2011; although the labour market is showing signs of tightening, an important consideration is the make-up of the inactive pool of labour that could be drawn upon to feed labour demand, and the degree of attachment to the labour market among the inactive pool.
- In-depth analysis of the Annual Survey of Household Earnings (ASHE) indicates that the introduction of minimum wage rates has a marked impact on the distribution of earnings, with the peak of the distribution shifting in line with changes in the minimum wage. This in turn has an impact on the rest of the distribution of earnings, with the distribution shifting upwards and to the right through time. However, this more reflects improvements in productivity and inflation driving up higher levels of earnings rather than what is happening at the bottom end of the distribution.
Special Feature on Inflation
United Kingdom
Households have seen the prices they pay for goods and services remain largely unchanged over the last year. The Consumer Prices Index – which measures changes in prices – fell by 0.1% in the year to October 2015. This means that a basket of shopping that cost £100.00 a year ago would cost £99.90 now. This is the same rate of inflation as seen in the year to September and continues the trend of negligible inflation that the UK has experienced since the start of 2015.
While the headline rate of inflation remains negligible, each household’s personal rate of inflation will depend on the products they buy. For example, prices for food and motor fuels continue to fall on the year, whereas prices for rents and eating out are rising.
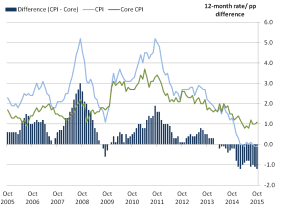
In making financial and economic decisions, it can be useful to consider what the rate of inflation will be in the future. One way that analysts attempt to do this is through excluding certain goods with volatile price movements from the rate of inflation. This measure is often referred to as “core” inflation – though this does not imply that these products are more or less important than others.
For most of the last 10 years (a short period in 2009 notwithstanding), core inflation has been lower than overall inflation. Since spring 2014, this picture has reversed due to the prices of many of the goods excluded from core inflation (notably motor fuel and food) falling.
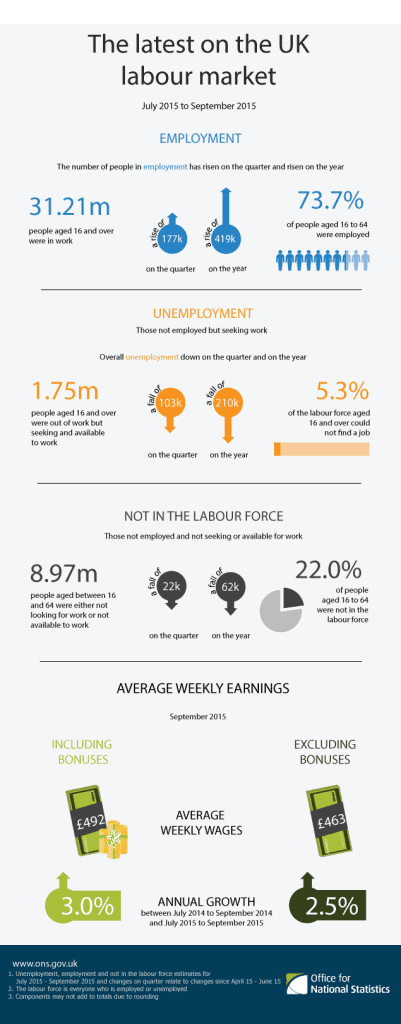
Comparing July to September 2015 with April to June 2015, the number of people in employment increased by 177,000 (to reach 31.21 million), the number of unemployed people fell by 103,000 (to reach 1.75 million) and the number of people aged from 16 to 64 not in the labour force (economically inactive) fell by 22,000 (to reach 8.97 million).