The main points for this month’s Economic Review by the Office for National Statistics (ONS) are provided hereunder:
Economic commentary
Commenting on the latest GDP figures, ONS Head of GDP Darren Morgan said:
“The economy grew slightly more in the last three months of 2016 than previously thought, mainly due to a stronger performance from manufacturing.”
“Overall, the dominant services sector continued to grow steadily, due in part to continued growth in consumer spending, although retail showed some signs of weakness in the last couple of months of 2016, which has continued into January 2017.”
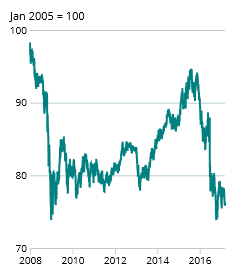
Value of sterling
Following the EU referendum, the value of sterling fell sharply against a basket of currencies at the end of June and into July.
In October 2016, the sterling Exchange Rate Index (ERI) fell a further 4.8% from the end of September 2016 and was 20% lower compared with October 2015.
Demand
Measures of demand in the economy for output which is produced. Retail sales cover a large part of consumers’ demand in a timely way. Business investment is an indicator of firms’ demand for capital and is also an indicator of businesses’ confidence for the future.
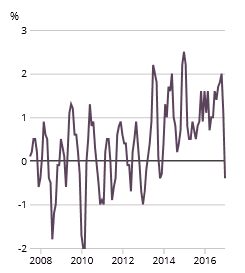
Retail Sales Index
The underlying pattern in January 2017 as suggested by the 3 month on 3 month movement decreased by 0.4%; the first fall since November 2013.
Trends to consider: Changes in retail sales could indicate changes in consumer confidence post-referendum. But other factors also influence retail sales such as prices, weather, and the overall financial position of households.
Updated: 17 February 2017
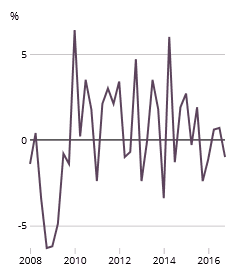
Business Investment
Business investment in Quarter 4 2016 decreased by 1.0% to £43.5 billion, when compared with the previous quarter. This was mainly due to a decrease in investment in other buildings and structures and transport equipment.
Trends to consider: Decisions to invest may change reflecting businesses’ assessment of the economy and their financial situations post-referendum.
Updated: 22 February 2017
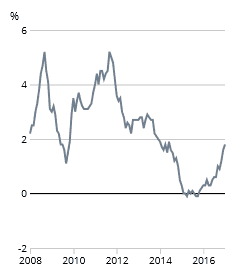
Inflation – Consumer Prices Index
The Consumer Prices Index (CPI) rose by 1.8% in the year to January 2017, compared with a 1.6% rise in the year to December. The rate in January 2017 was the highest since June 2014.
Trends to consider: Movements in CPI can be influenced by the strength of domestic supply and demand and also changes in the UK prices of imports. The inflation rate also depends on price levels in the preceding year. The sharp depreciation of the pound making the sterling price of imports more expensive may be a key factor in coming months.
Updated: 14 March 2017
House Price Indices
Housing market indicators for December suggested consistent increases in price. UK House prices grew by 7.2% in the year to December, 1.1 percentage points higher than November. However, this still remains below the levels of annual growth seen in the first half of the year.
Trends to consider: In the longer term, decisions to buy houses and prices may change as households reassess the economic and their financial situations post-EU referendum.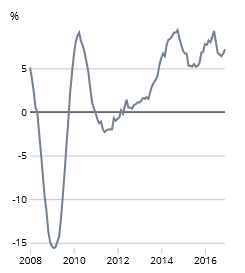
Investment Markets – Sentiment is mixed
Surveys show rather mixed levels of sentiment among investors. It is certainly the case that in recent months capital has generally flowed away from bonds into equities, and from emerging into developed market assets. However, cash levels remain high, and flows outside US markets rather modest. One explanation for this is high levels of political uncertainty. This is focused on the spate of elections and referenda in Europe but also encompasses geopolitical tensions in Asia and the Middle East, as well as the ‘bedding in’ challenges faced by the new Trump administration.
Although it is certainly the case that politics can spark short term market volatility, and political developments require careful monitoring, not all risks will crystallise and, at least in the short term, some may be growth accretive. Despite the obvious political shocks of 2016, equity markets and bond yields both ended higher as investors began to price in a cyclical improvement in global activity that would be sufficient to allow the Federal Reserve to renew monetary tightening.
Source: Standard Life Investments, February 2017
As I write, US markets are up on the news the Federal Reserve raised interest rates on Wednesday 15th March. The central bank raised rates by a quarter percentage point to 0.75 – 1% responding to the continued pick up in US inflation and job creation. As signalled by Janet Yellen, chair of the Fed board of governors, this is a sign the US economy is “on a healthy footing as unemployment is falling, and so rates need to go up to limit rising inflation.”
Unit Trust Sectors
The month of February was a good month for markets with all Unit Trust Sectors posting positive returns. The strongest performing sector was US Equities which have been buoyant on the back of promised fiscal easing, and business deregulation by the Trump administration. At the other end, Targeted Absolute Return has seen flat to modest rises for the month. The trend from the previous month continues in that all Unit Trust Sectors have shown very strong numbers over 1 year, again with the exception of Targeted Absolute Return, whilst acknowledging this is still positive. Worthy of note over 1 year being North American Smaller Companies and Global Emerging Markets posting 46% and 44% respectively. We certainly do not see such strong returns continuing into 2017, unless our currency continues to depreciate given the backdrop of the UK leaving the European Union. The Queen has now given Royal Assent to the Brexit bill, clearing the way for Theresa May to start talks to leave the European Union. Mrs May says she will trigger the process by the end of the month. This will undoubtedly mean further uncertainty and volatility for the year ahead.
Below we provide a table of the major sectors that we allocate to when constructing our client portfolios. The data has been sorted over 1 month in order of best to worst returns. We have shown returns on an annualised basis for 1 year and above.
| Sector | 1 Month | 3 Month | 6 Month | 1 Year | 3 Year Ann. | 5 Year Ann. | 10 Year Ann. |
| North American Smaller Companies | 4.05 | 7.06 | 18.54 | 46.68 | 16.19 | 17.37 | 12.29 |
| North America | 4.01 | 7.82 | 15.70 | 37.78 | 18.99 | 17.22 | 10.85 |
| Asia Pacific Excluding Japan | 3.30 | 7.95 | 10.65 | 40.68 | 13.60 | 9.16 | 9.48 |
| Global Emerging Markets | 3.22 | 9.53 | 10.54 | 44.00 | 11.32 | 4.92 | 6.91 |
| UK Gilts | 3.21 | 2.49 | -5.83 | 7.01 | 7.70 | 4.60 | 5.82 |
| UK Smaller Companies | 2.96 | 9.76 | 11.33 | 20.56 | 6.36 | 13.58 | 7.53 |
| UK All Companies | 2.41 | 6.93 | 7.39 | 19.10 | 5.05 | 9.41 | 5.34 |
| European Smaller Companies | 2.39 | 9.60 | 9.03 | 25.96 | 11.30 | 15.23 | 8.45 |
| Sterling Corporate Bond | 2.27 | 3.12 | -1.90 | 10.98 | 5.88 | 5.84 | 4.56 |
| Japan | 2.07 | 5.44 | 13.27 | 35.20 | 16.61 | 13.03 | 5.26 |
| Property | 1.61 | 2.98 | 2.69 | 6.86 | 7.16 | 6.25 | -0.43 |
| UK Index Linked Gilts | 1.42 | 3.31 | -2.81 | 20.59 | 12.76 | 8.13 | 8.28 |
| Europe Excluding UK | 1.22 | 7.92 | 7.70 | 23.00 | 7.93 | 11.79 | 5.87 |
| Sterling High Yield | 1.18 | 3.82 | 3.56 | 15.15 | 3.79 | 5.96 | 5.15 |
| Global Bonds | 0.96 | 1.70 | 0.04 | 9.51 | 4.79 | 3.43 | 5.31 |
| Targeted Absolute Return | 0.41 | 1.42 | 1.28 | 2.58 | 1.74 | 2.88 | 3.17 |
Source: FE Analytics, Percentage growth to last month end 28th February 2017